Insights is the product.
The modules stand on it.
Kamino is bought in one order, and it is not an accident. Connect your data, get the operating picture, then turn on the modules the data now supports. Insights, the fabric plus ask, report and dashboards, is what ships and what you buy first. Projects and Planning are paid modules on top of it, and they are being built.
- reports
- 41
- KPIs
- 108
- domains connected
- 8
Fabric at the base. Insights over it. Modules off the trunk.
Every domain terminates at one interchange, the data fabric. Insights is what leaves it, and it is the product. Projects and Planning stand on that trunk rather than beside it, and both are still being built, because a module is only as good as the domains feeding it.
A forecasting tool sold on its own asks you to type your assumptions into an empty box. Kamino’s forecast starts from records that already exist. That is the difference between a module on a fabric and a tool on its own.
Architecture · ten domains in, one interchange, two dashed branches
What each product is made of
Insights is the base subscription and the modules stand on it: three products and 14 components. Three of them are shipped and eleven are being built, drawn solid and dashed in that order, and neither module carries a date.
Composition · three products, 14 components, solid where shipped
Insights
The base subscription- Ask
- Report
- Dashboards
Projects
Paid module- Budgets
- Quotes
- Contracts
- Delivery
- Invoicing
- Resourcing
Planning
Paid module- Company plan
- Forecast
- Scenarios
- Statements
- Cash
Insights, the primary product
Shipped. Four surfaces, one set of records.
Kamino sits over the books you already keep and answers operating questions from them. Nothing here asks you to re-enter data, maintain a model, or accept a figure on faith.
Insights is also the part the whole team uses, not just finance: every role reads it through its own drill-down ceiling, set per data domain, so a producer can open project economics without ever reaching an individual cost rate. The modules sit on top of that same fabric and inherit the same ceilings. See the five roles.
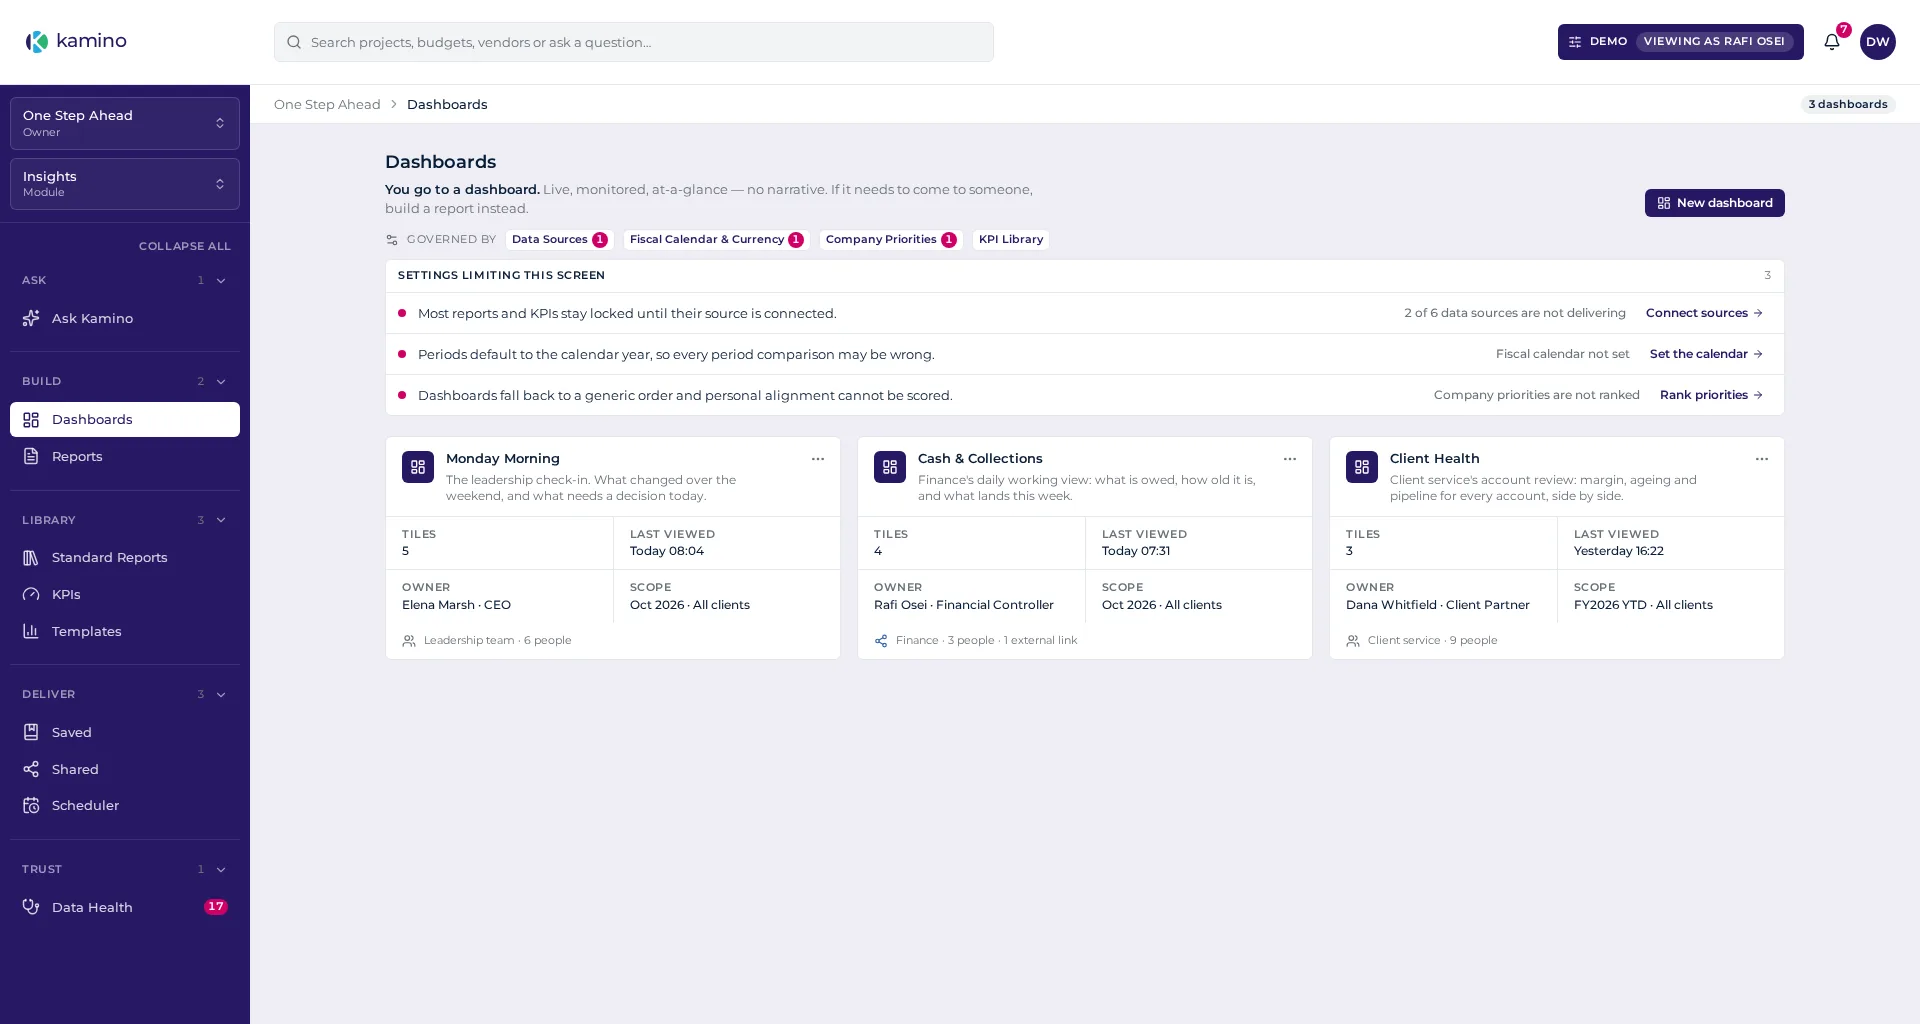
Insights · Dashboards
Illustrative demo data · One Step Ahead, a fictional agency
Every surface described below is in that left rail. The four are one product, not four purchases.
Data fabric
Eight connected domains, one reconciled set of records.
In the rail above
Settings · Unified Data Fabric, and Data Health
The base of everything. The accounting platform is one line among eight, starting with QuickBooks Online and with more accounting platforms opening. Around it run the systems that actually hold the truth about delivery. The fabric keeps them reconciled so that two questions asked two ways cannot give you two answers.
Ask
The assistant. A question in words, an answer with its working shown.
In the rail above
Ask Kamino
Type the question you would put to a finance person. You get the figure, the arithmetic that produced it, the scope it was measured over and the records it used. If something is unassigned or provisional, the answer says so as an exception rather than quietly rounding past it. The query runs inside the fabric rather than in a chat window.
Report
A 41-report catalogue, run against your own books.
In the rail above
Reports, and Standard Reports in the library
Profit and loss by project. Client contribution. Department utilisation. Ageing that ties to the invoice. You are not designing report layouts at 11pm; you are choosing which of the 41 you want and which scope to run it at.
Dashboards
108 KPIs in the catalogue, scoped the way you run.
In the rail above
Dashboards, and KPIs in the library
Not a wall of gauges. A working picture: which jobs are carrying the quarter, which client is quietly expensive, where hours went. Click any tile and the records behind it open.
Ask it in words. Your records are never handed to the model to search.
Shipped
Every tool in this category can now put a chat box over your books, and most of them do it by handing your books to somebody else’s model to search. Kamino does not. The model receives your question and the shape of your data: table and field names, the scope, the period. It writes the query; Kamino runs it against your records itself.
The assistant inside your accounting platform answers from the ledger. Put one in each platform and each is right about its own system, which is a different thing from being right. Why not just use an agent
That is a fact about the architecture rather than a promise about retention, and it is why the assistant can sit over stitched payroll, cost rates and margins at all. The per-role drill-down ceiling applies to it exactly as it applies to a grid or an export. How the ceilings work
You ask
In words
The question you would put to a finance person, typed as you would say it. No query language to learn, no report to configure first.
The model reads the shape
Schema, not rows
It is given the question, your table and field names, the scope and the period. It is not given a row of your ledger, and it does not search your data to find the answer.
Kamino runs the query
kscript
The model writes the query in kscript, Kamino's own query language. Kamino runs it against your records itself, inside the fabric, under the same per-role ceilings as every other surface.
You get the working
Figure, arithmetic, records
The answer arrives with the arithmetic that produced it, the scope it was measured over and the records it used. If something is unassigned or provisional, it says so rather than rounding past it.
The read-out is written
A summary, not the rows
The paragraph under the answer is written by the model from a summary of the result: the totals, and the largest and smallest entries by name and amount. The rows themselves stay in the fabric.
Why an agent cannot copy it
The model never calculates a figure
It writes a query. Kamino computes every number from your records, so a question the model misreads produces a wrong query you can read, never an invented total. A company admin can open the exact query behind any answer.
The plumbing is already written
QuickBooks returns subtotal and group lines in the same list as the real ones, and a card refund arrives as a purchase with a flag on it. Read literally, the first counts amounts twice and the second adds the refund to your expenses. Kamino handles both, and the quirks like them, once, in tested code. An agent reads the same payload fresh on every question.
Better models help, and the figures do not rest on them
The model does one job: turning your question into a query. A better model does that job better and Kamino picks it up. The arithmetic never depended on the model, so a figure does not move when the model changes.
Paid modules, gated on data
Being built
Projects and Planning are add-ons on top of the base subscription, not alternative products. Neither is available yet. Both are gated on data coverage, and that is the whole point: you cannot forecast cash without receivables and payables, and you cannot say whether a project made money without time, payroll and resourcing. The modules do not merely use the fabric. They are impossible without it.
Module pricing is an add-on on top of a plan. It is quoted rather than published, because the figures are not yet settled against what checkout will charge. Ask, and you will get the number and the reasoning. Neither module is available yet, and neither carries a date. See the pricing page.
Projects
Being builtCost and vendor questions get answered against the job rather than the account code. A producer can ask what a vendor has actually cost across three projects and open the bills behind the number. It is being built with the rest of the module.
Needs these domains first
Time tracking · Payroll · Resourcing
Whether a project made money is not a ledger question. It needs the hours that went into it, what those hours actually cost once payroll burden is included, and who was committed elsewhere. Until those domains are connected, a project module can only show you what you invoiced.
In scope
- Budgets
- Quotes
- Contracts
- Delivery
- Invoicing
- Resourcing
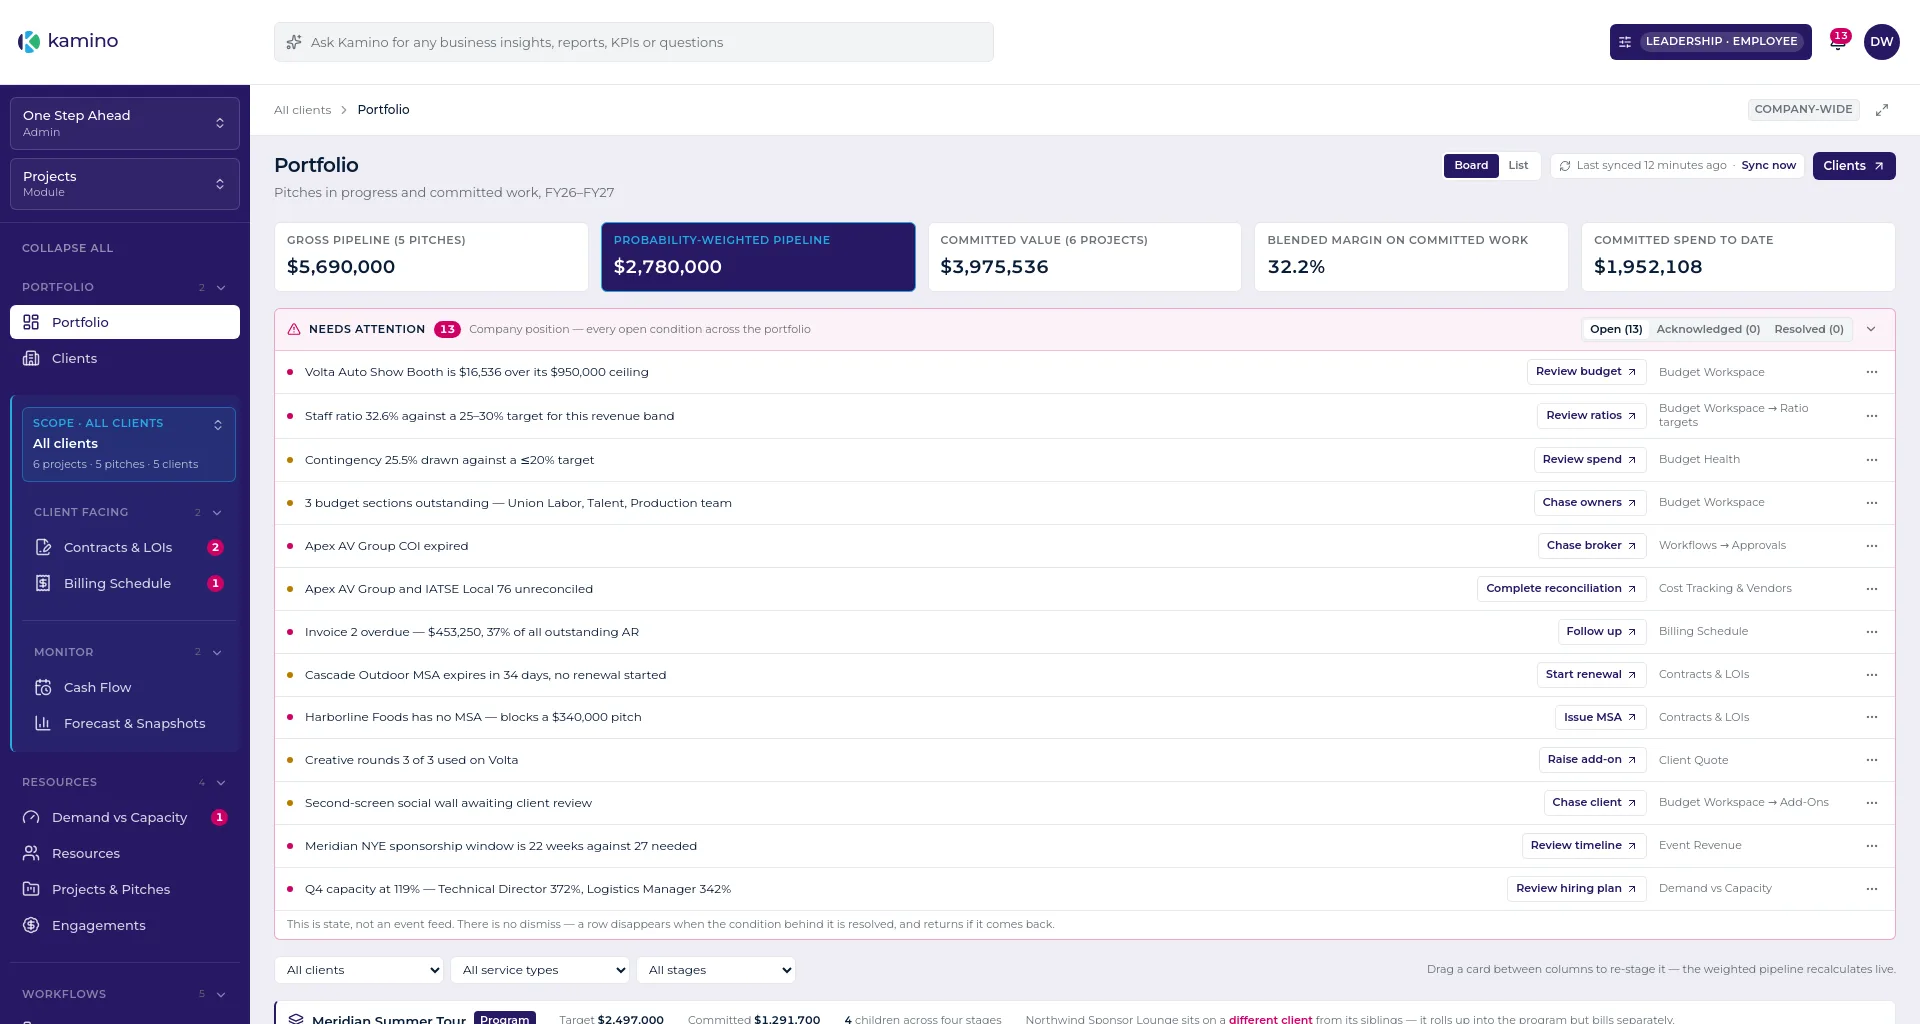
Projects · Portfolio
Design preview of a module still being built · illustrative demo data · One Step Ahead, a fictional agency
Planning
Being builtIt reads the connected sources for the contradictions a forecast would otherwise inherit: an unassigned cost, a period that does not tie, a source that has stopped delivering. It names them instead of modelling straight through them, and it ships when the module does.
Needs these domains first
Accounts Receivable · Accounts Payable · CRM
A forecast is only as good as the commitments behind it. Cash needs what is owed to you and what you have already committed to pay. Revenue needs a pipeline with real deal records against it. Without those, a plan is just your assumptions retyped.
In scope
- Company plan
- Forecast
- Scenarios
- Statements
- Cash
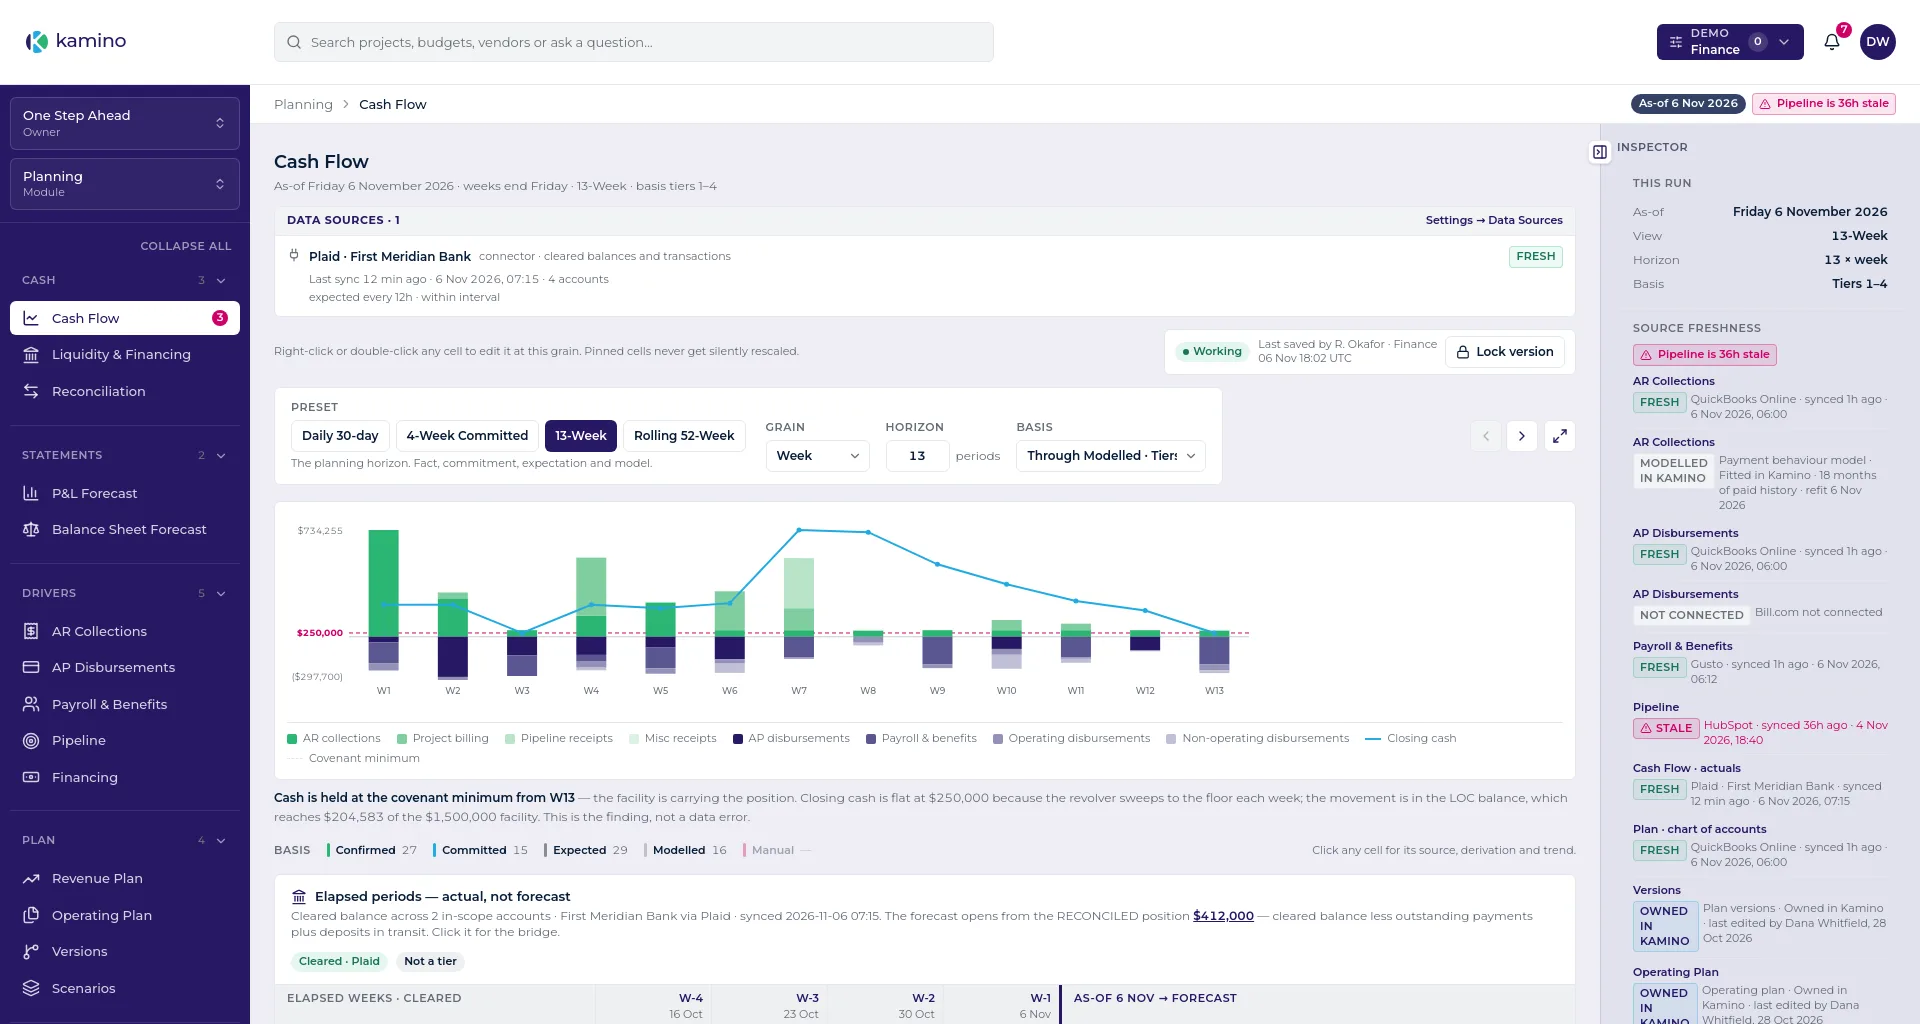
Planning · Cash Flow
Design preview of a module still being built · illustrative demo data · One Step Ahead, a fictional agency
No delivery dates are published against either module. Building means building. Each screen above is a design preview, not a shipped product. It shows what is being built, which is a different claim.
The lines that feed it
QuickBooks Online is where we started, not the spine. Eight domains connect: QuickBooks Online and HubSpot by direct API, and the rest by spreadsheet import, which lights a domain up without waiting on anybody’s API. The two lines still to open, AR & Collections and Bank, are drawn dashed because they are not available at launch. We draw a line dashed rather than describe it as if it were running.
- Accounting
- Direct API · connected
- Invoices, bills, journals, the chart of accounts
- CRM
- Direct API for HubSpot, spreadsheet import otherwise · connected
- What has been won and what is quoted
- Accounts Payable
- Spreadsheet import · connected
- Vendor bills and what you have committed to pay
- Resourcing
- Spreadsheet import · connected
- Who is committed, and to what
- HR
- Spreadsheet import · connected
- Headcount, departments, joiners and leavers
- Payroll
- Spreadsheet import · connected
- What the people on the job actually cost
- Expenses
- Spreadsheet import · connected
- Card spend and recharges tagged to a job
- Time Tracking
- Spreadsheet import · connected
- Approved hours, billable and not
- AR & Collections
- Direct API or spreadsheet import · coming soon
- Dunning status, promises to pay, collections effort
- Bank
- Direct API · coming soon
- Cleared balances and the money that actually moved
- Connected: by direct API or spreadsheet import
- Coming soon: not available at launch, no date published
See what’s behind any figure
The interaction the whole product turns on: click a figure and the records behind it open, with the derivation written out. Illustrative demo data for One Step Ahead, a fictional agency.
Figures · company, department, project
Company line
$453,250
Revenue, year to date
- Scope
- One Step Ahead · all projects · 1 Jan – 8 Aug 2026
- Derivation
- Sum of posted sales invoices in the accounting platform, income accounts only, credit notes netted, tax excluded.
Records behind the figure · illustrative demo data
- INV-1042$128,400Northbank Product LaunchNorthbank Retail · posted 14 Feb 2026
- INV-1043$96,750Halberd Sales KickoffHalberd Industries · posted 2 Mar 2026
- INV-1051$84,200Marlow Group RoadshowMarlow Group · posted 21 Apr 2026
- INV-1055$72,900Citycrest Awards NightCitycrest Media · posted 9 Jun 2026
- INV-1060$41,000Vantage Dealer SummitVantage Motors · posted 17 Jul 2026ExceptionTwo recharged expenses on this job are still unbilled.
- INV-1064$30,000Northbank Retainer Q3Northbank Retail · posted 1 Aug 2026
Records behind the figure · illustrative demo data Invoice Project / client Amount INV-1042 Northbank Product LaunchNorthbank Retail · posted 14 Feb 2026 $128,400 INV-1043 Halberd Sales KickoffHalberd Industries · posted 2 Mar 2026 $96,750 INV-1051 Marlow Group RoadshowMarlow Group · posted 21 Apr 2026 $84,200 INV-1055 Citycrest Awards NightCitycrest Media · posted 9 Jun 2026 $72,900 INV-1060 Vantage Dealer SummitVantage Motors · posted 17 Jul 2026ExceptionTwo recharged expenses on this job are still unbilled. $41,000 INV-1064 Northbank Retainer Q3Northbank Retail · posted 1 Aug 2026 $30,000 Six invoices. Nothing aggregated that you cannot open.
Demo extract · corrected to QuickBooks Online, 8 Aug 2026, 07:15
Company line
31.4%
Gross margin, year to date
- Scope
- One Step Ahead · all projects · 1 Jan – 8 Aug 2026
- Derivation
- ($453,250 revenue − $310,929 direct cost) ÷ $453,250 = 31.4%. Direct cost is the four cost-of-delivery accounts below; overhead is excluded.
Records behind the figure · illustrative demo data
- 5000$148,600Subcontracted deliveryProduction partners billed to a job
- 5100$96,220Venue & production hireSpace, rigging, AV, power
- 5200$34,109Travel & accommodationCrew movement on client jobsException$4,180 of this sits on no project. It is in this total and on no job, so no project carries it.
- 5300$32,000Freelance crewDay-rate staff, on-site only
Records behind the figure · illustrative demo data Account What it holds Amount 5000 Subcontracted deliveryProduction partners billed to a job $148,600 5100 Venue & production hireSpace, rigging, AV, power $96,220 5200 Travel & accommodationCrew movement on client jobsException$4,180 of this sits on no project. It is in this total and on no job, so no project carries it. $34,109 5300 Freelance crewDay-rate staff, on-site only $32,000 Margin $142,321. The subtraction is shown, not asserted.
Demo extract · corrected to QuickBooks Online, 8 Aug 2026, 07:15
Department line
1,166 hrs
Billable hours delivered
- Scope
- One Step Ahead · four departments · 1 Jan – 8 Aug 2026
- Derivation
- Approved timesheet hours tagged billable, grouped by the department on the employee record.
Records behind the figure · illustrative demo data
- PRD512Production9 people, 2 on retainer
- CRE318Creative5 people
- CLS214Client Services4 people
- TEC122Technical2 peopleException31 hrs booked to a closed job. Someone has to move them.
Records behind the figure · illustrative demo data Dept Team Hours PRD Production9 people, 2 on retainer 512 CRE Creative5 people 318 CLS Client Services4 people 214 TEC Technical2 peopleException31 hrs booked to a closed job. Someone has to move them. 122 Hours are records too, and they travel the same line.
Demo extract · corrected to QuickBooks Online, 8 Aug 2026, 07:15
Project line
$204,583
Contribution, top three projects
- Scope
- One Step Ahead · three projects · 1 Jan – 8 Aug 2026
- Derivation
- Project revenue less direct cost tagged to the same project. Overhead is not allocated, because allocating it would be an opinion.
Records behind the figure · illustrative demo data
- P-118$89,412Northbank Product LaunchNorthbank Retail · closed 30 Mar 2026
- P-124$64,208Halberd Sales KickoffHalberd Industries · closed 12 Apr 2026
- P-131$50,963Marlow Group RoadshowMarlow Group · in deliveryExceptionIn delivery: cost still landing. Read it as provisional.
Records behind the figure · illustrative demo data Project Client Contribution P-118 Northbank Product LaunchNorthbank Retail · closed 30 Mar 2026 $89,412 P-124 Halberd Sales KickoffHalberd Industries · closed 12 Apr 2026 $64,208 P-131 Marlow Group RoadshowMarlow Group · in deliveryExceptionIn delivery: cost still landing. Read it as provisional. $50,963 Three projects out of nineteen. The other sixteen carry $61,204 between them.
Demo extract · corrected to QuickBooks Online, 8 Aug 2026, 07:15
Company line · $453,250, Revenue, year to date
Four figures from a fictional agency’s books. Each one is the sum of records you can open, and the arithmetic checks by hand.